A Brief Exploration of OCR Techniques: 3. Feature Extraction (2)
Layer-by-Layer Recognition
Once the image has been effectively stratified into layers, we can proceed with our earlier assumptions and design a corresponding model, working layer by layer to locate the text regions in the image.
Connectivity
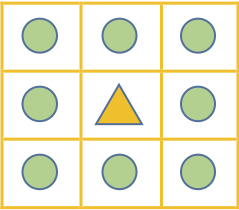 8-connectivity
As we can see, the image in each layer is made up of a number of connected regions, and since text is composed of relatively dense strokes, text itself tends to form a connected region as well. Here connectivity is defined as 8-connectivity: the 8 pixels surrounding a given pixel are all defined as its neighbors, and neighboring pixels are considered part of the same connected region.
Once connectivity has been defined, each layer is split into a number of connected regions — in other words, we progressively decompose the original image, as shown in Figure 9.more
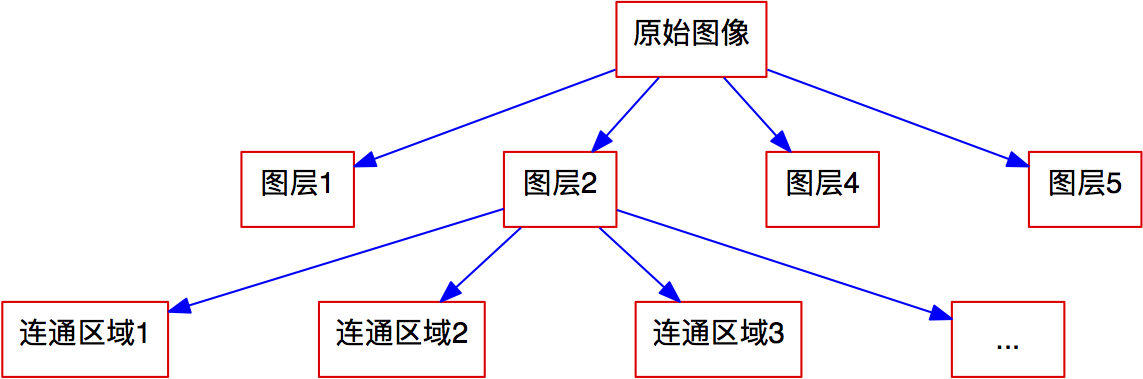 Figure 9: Image decomposition structure
Erosion Resistance
Once the image has been decomposed down to the granularity of connected regions, we stop subdividing further, and the next step is to identify which of these regions are likely text regions. Here we require that text regions exhibit a certain degree of erosion resistance. So let us first define erosion.
Erosion is a morphological transformation on images, typically applied to binary images. For a nonzero pixel (i.e., a pixel with value 1) in a binary image, if all of its neighboring pixels are also 1, it remains unchanged; otherwise it becomes 0 — here again we use the 8-connectivity definition. Notice that the longer the boundary of a connected region, the more "damage" the erosion operation does to it; conversely, the shorter the boundary, the less damage erosion causes.
Based on this definition of erosion, we can state a requirement for text regions:
Erosion-Resistance Requirement
The connected region containing text should have a certain degree of erosion resistance.
The word "certain" here refers to a continuous range — neither too large nor too small. For example, a large square region has very strong erosion resistance because its boundary is short, but such regions are clearly not text regions; the rice cooker in layer 5 of the decomposition in the previous post falls into this category. On the other hand, erosion resistance that is too weak is also unacceptable — thin, elongated lines, for instance, may disappear entirely after erosion, and these should not be treated as candidate text regions either; the boundary lines in layer 4 of the previous post's decomposition fall into this category.
We can define a metric for erosion resistance as follows:
$$\text{erosion resistance of region}=\frac{\text{total area after erosion}}{\text{total area before erosion}}\tag{7}$$
Through testing, we find that the erosion resistance of text regions generally falls within the range $[0.1,0.9]$.
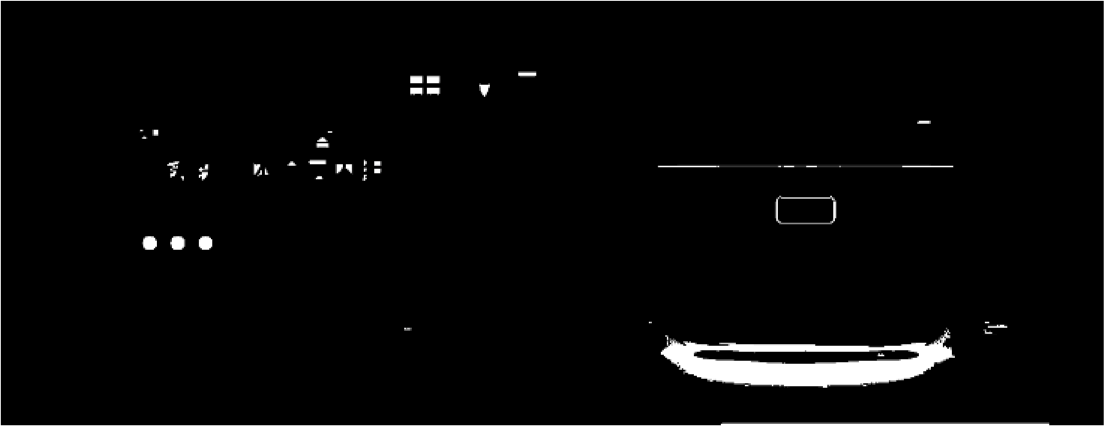
After filtering the 5 decomposed layers by erosion resistance, we obtain the feature layers shown below.
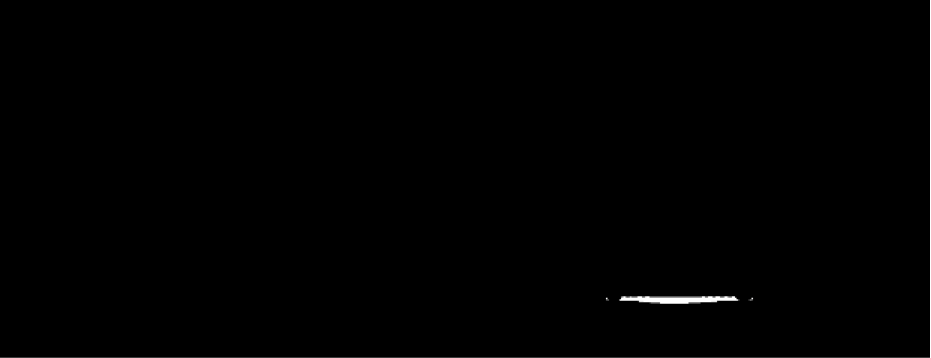 Feature layer 1
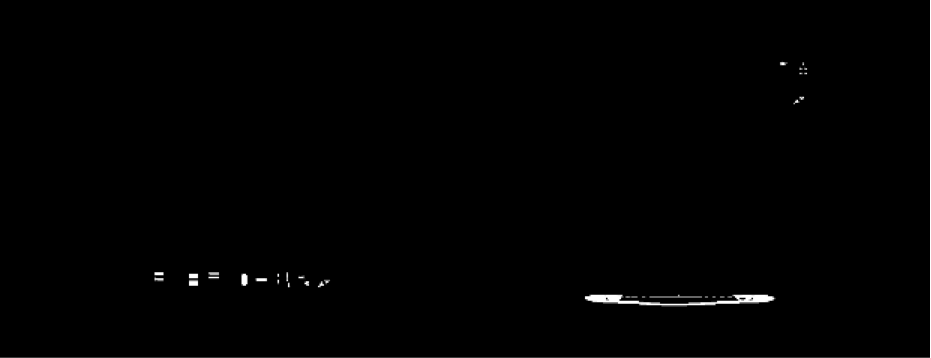 Feature layer 2
 Feature layer 3
 Feature layer 4
![Only connected regions with erosion resistance in the range $[0.1,0.9]$ are retained](https://kexue.fm/usr/uploads/2016/06/3875269463.png) Only connected regions with erosion resistance in the range $[0.1,0.9]$ are retained
Only connected regions with erosion resistance in the range $[0.1,0.9]$ are retained
Pooling Operation
At this point we have obtained 5 feature layers. Although the naked eye can tell that the text is mainly concentrated in the 5th feature layer, for a general image the text may be distributed across multiple feature layers, so the feature layers need to be integrated. The method we use for integrating features here is similar to "pooling" in convolutional neural networks, hence we borrow the same name.
First, we superimpose the 5 feature layers to obtain a single overall image feature (called the superimposed feature). This superimposed feature could be used directly as the final output feature, but that is not the best approach. We believe the main text features within a given region should already be concentrated in a single feature layer rather than scattered across all of them. Therefore, after obtaining the superimposed feature, we integrate the features using something like "max pooling," following these steps:
1. Directly superimpose the feature layers, then partition the superimposed feature into connected regions.
2. For each connected region, determine which feature layer contributes the most, and keep that connected region only from that layer's source.
After this pooling operation, the resulting final feature is shown in Figure 11.
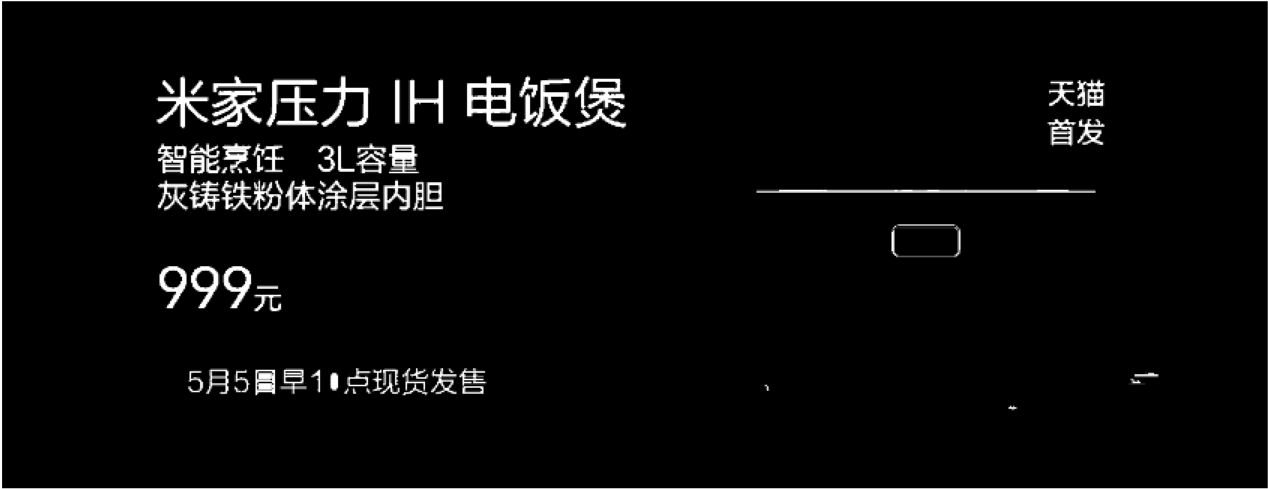 Figure 11: Feature after pooling
Post-Processing
For the image we used as our demonstration, the feature map in Figure 11 obtained after the above operations already requires no further processing. However, for general images, there may still be some poorly handled regions, in which case further exclusion is needed on top of the previous results. The exclusion process mainly consists of two steps: exclusion of low-/high-density regions, and exclusion of isolated regions.
Density-Based Exclusion
One type of connected region that is clearly not a text region is a low-density region. A typical example is a connected region formed by table gridlines — such a region covers a large area but has very few points, i.e., a very low density, and such low-density regions can be excluded. First, let us define connected-region density and low-density regions:
Connected Region Density
Starting from a connected region, we can find its horizontal bounding rectangle. The density of the region is defined as
$$\text{connected region density}=\frac{\text{area of connected region}}{\text{area of bounding rectangle}}\times \frac{\text{original image total area}}{\text{area of bounding rectangle}}\tag{8}$$
Low-Density Region
If the density of a connected region is less than 16, the connected region is defined as a low-density region.
Intuitively, the definition should be $\frac{\text{area of connected region}}{\text{area of bounding rectangle}}$, but here we add an extra factor $\frac{\text{original image total area}}{\text{area of bounding rectangle}}$, which is meant to incorporate the effect of area size, since text generally has clear boundaries and is easily segmented — so, generally speaking, the larger the area, the less likely a region is to be a text region. The parameter 16 here is an empirical value.
Excluding low-density regions is an effective way to rule out non-text regions with many lines, such as tables. Similarly, large high-density regions are another type of region that needs to be excluded. Once we have low-density regions, high-density regions are easy to define:
High-Density Region Definition \cdot
If, after inverting a connected region's horizontal bounding rectangle, the resulting region is a low-density region, then the connected region is defined as a high-density region.
This definition is natural, but it has a certain flaw. For example, consider the character "一" (one), which is a horizontal rectangle; after inversion, its density becomes 0, so this character "一" would be excluded, which is unreasonable. One way to fix this is:
High-Density Region Definition
A region is defined as a high-density region if and only if the following condition holds:
$$\frac{1+\text{area of bounding rectangle}-\text{area of connected region}}{\text{area of bounding rectangle}}\times \frac{\text{original image total area}}{\text{area of bounding rectangle}} < 16\tag{9}$$
This adds 1 to the original definition, preventing the case where the density becomes 0 after inversion.
There is yet another failure case: if the input image is a single-character image, then there is only one connected region, and $\frac{\text{original image total area}}{\text{area of bounding rectangle}}$ is close to 1, so it would be judged as a low-density region, thereby excluding the single character. This case is indeed difficult to fully accommodate. One workable solution is to let the user manually specify whether the mode is single-character, single-line, or full-image mode — Google's Tesseract OCR also offers such an option.
Isolated Region Exclusion
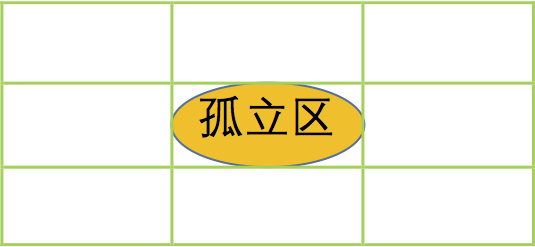 Isolated region illustration
The rationale behind excluding isolated regions is this: text characters and strokes should generally be fairly close together, so if a region is clearly isolated from other regions, it is unlikely to be a text region. In other words, we can exclude isolated regions. First, let us define the concept of an isolated region:
Isolated Region Starting from a connected region, we can find its horizontal bounding rectangle, and expand this rectangle symmetrically about its center to 9 times its original area (i.e., its length and width each become 3 times larger, as shown in the figure on the left). If the expanded region does not contain any other connected region, the original connected region is called an isolated region.
In most cases, excluding isolated regions is a very simple and effective denoising method, since many noise points form isolated regions. However, there is some risk involved in excluding isolated regions. If an image contains only a single character, forming the sole connected region, that connected region would be isolated, and the character would end up being excluded. Therefore, additional constraints should be placed on isolated-region exclusion. One optional additional constraint is: the proportion $\frac{\text{area of connected region}}{\text{area of bounding rectangle}}$ of the excluded isolated region must be greater than 0.75 (this value comes from the ratio of the area of a circle to its bounding square, $\pi/4$).
Translated automatically with claude-sonnet-5; all equations are reproduced verbatim from the source. Copyright remains with the original author.